Tuesday 7 September 2010

The Story So Far....

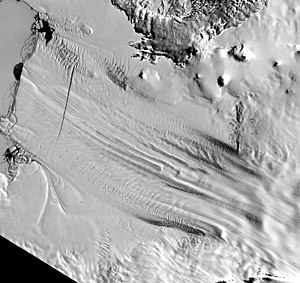
Landsat image of the Pine Island Glacier ice s...Image via Wikipedia
A few notes from watching the videos and reading the articles previously posted.
25 years of satellite data looking at atmospheric temperature shows no significant rise, according to the documentary "Doomsday Called Off". Similar results are seen in data from weather balloons over the same period. Other articles show a global temperature rise, using the same data.
The sea level around the Maldives has fallen between 20 to 30cm since the 1970s, due to increased evaporation.
The East Antarctic ice sheet is growing  due to increased precipitation.
Increased meltwater from Antartica's Pine Island Glacier may be due more to changing sea-bed conditions than to temperature. An undersea ridge appears to have been ground away, and this allows relatively warner seawater greater access to the underside of the glacier....

More on the Maldives:

Professor Niels-Axel Mörner, a leading world authority on sea levels and coastal erosion who headed the Department of Paleogeophysics & Geodynamics at Stockholm University:
The Maldives like other low-lying areas have been condemned by IPCC to become flooded in 50-100 years. The INQUA Commission on Sea Level Changes and Coastal Evolution (the international organisation that hosts the true world specialists on sea level changes) have studied the actual sea level changes in the Maldives and hope to be able to extend the studies to other parts of SE Asia. Our findings reveal that there is no reality behind the scenario of a recent future flooding. The sea level has not been rising in the Maldives in the last centuries and at around 1970 it even experienced a significant lowering. The models of IPCC are simply over-ruled by the theory and observation by sea level specialists within INQUA. We should all be happy about this, one would assume. This is not the case, however. The government of the Maldives has put much prestige in the fear of a future flooding, accusing the west of having caused this situation and demanding them to pay for it. Without a flooding scenario, they now fear that international aid might be cancelled. In this situation, our scientific studies in the Maldives are regarded as anti-governmental and we are now working under very complicated conditions. For the people of the Maldives it is a great relief not to live under a constant threat that all will be gone in one or two generations. For science it is necessary to be able to go on recording the true story and not having to rely on absurd models not anchored in field observations. For a poor country like the Maldives they should always be entitled to become assisted by countries in the west. Furthermore, a coastal country like the Maldives is always threatened by coastal events (storms, hurricanes, tsunamis, etc) that may have disastrous effects on a short-term scale.


Enhanced by Zemanta

Global Warming - Doomsday Called Off (1/5)

Climate data Information

Relationship of Earth's orbit to periods of gl...Image via Wikipedia
http://www.climatedata.info
A lot of data on climate and climate change are available on the internet but they are not presented in a way which makes them easy to understand. Where climate data are available in a digestible form they are often being used to support one side or the other of highly polarised positions. We are trying to prove only one thing: rational debate is possible when participants have access to the facts. On this site you will find graphs, explanation and data related to essential aspects of climate change. Everything can be downloaded for free and the data files can be input directly to spreadsheets on Windows, Macintosh and UNIX operating systems.
 The climate information and data are available in the following subject areas:
* Temperature - observed and climate model simulations of Global, European and American temperature.
* Precipitation - observed and climate model simulations of Global, European and American precipitation.
* Greenhouse Gases - variation of CO2 and methane over time and a break-down of CO2 by source and geographical origin; the influence of greenhouse gases on climate.
* Proxy data: (i) Ice Cores - Antarctic, Arctic and glaciers with temperature and other data for 100s of thousands of years. (ii) Tree Rings - data from northern and southern hemisphere countries with temperature estimates for 100s of years.
* Natural Climate Forcing - albedo (reflectivity) of earth; orbital variations (Milankovitch cycles) ; sun-spots; El Niňo and other oscillations; radio-sonde temperature profiles.
* Climate Impacts - Global sea level; snow cover, Arctic and Antarctic sea ice; tropical cyclones; polar bears.
Powered by ScribeFire.
Enhanced by Zemanta

Indian Ocean sea-level rise threatens coastal areas | Science Blog

Indian Ocean sea-level rise threatens coastal areas | Science Blog
While several areas in the Indian Ocean region are experiencing sea-level rise, sea level is lowering in other areas. The study indicated that the Seychelles Islands and Zanzibar off Tanzania’s coastline show the largest sea level drop.

“Global sea-level patterns are not geographically uniform,” says NCAR scientist Gerald Meehl, a co-author of the paper. “Sea-level rise in some areas correlates with sea-level fall in other areas.”


Powered by ScribeFire.

Estimation of sea level change

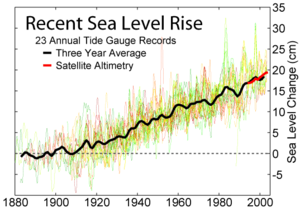
Sea level has been rising cm/year, based on me...Image via Wikipedia

Estimation of sea level change
Global sea levels have traditionally been estimated from tide gauges. As can be imagined they show fluctuations of several meters due to tide and wave action. Identifying sea level changes of a few millimetres a year against this background “noise” is problematic. Since 1993, data are available from satellites. There are two other factors which add to the difficulty of estimate changes in sea level. The first is the way the earth has reacted to the melting of the ice caps. Where major ice melt has taken place, in northern Europe and North America for example, land levels have risen; the post glacial rebound (PGR). Conversely where sea levels have risen and encroached on previously dry areas, land levels have fallen; glacial isostatic adjustment (GIA). (Some sources use the two terms interchangeably) These changes typically average around 4 mm/decade but can be higher in some locations. The second factor is the influence of atmospheric pressure. The changes in pressure can be seasonal and modify levels by 1 metre; often an allowance is made for these pressure difference by applying what is called “an inverted barometer.” As can be seen the adjustments to be made to sea level are of a similar order of magnitude to change in sea level itself. It is generally considered that the rate of change of sea level cannot be accurately estimated for periods of less than 10 years.
Powered by ScribeFire.
Enhanced by Zemanta

Diesels greener than battery cars, says Swiss gov report • The Register

Diesels greener than battery cars, says Swiss gov report • The Register
Swiss boffins have mounted an investigation into the largely unknown environmental burdens of electric cars using lithium-ion batteries, and say that the manufacturing and disposal of batteries presents no insurmountable barriers to electric motoring. However, their analysis reveals that modern diesel cars are actually better for the environment than battery ones.

The revelations come in a new report issued by Swiss government research lab EMPA, titled Contribution of Li-Ion Batteries to the Environmental Impact of Electric Vehicles. The Swiss boffins, having done some major research into the environmental burdens of making and disposing of li-ion batteries - to add to the established bodies of work on existing cars - say that battery manufacture and disposal aren't that big a deal. However, in today's world, with electricity often made by burning coal or gas, a battery car is still a noticeable eco burden:

The main finding of this study is that the impact of a Li-ion battery used in [a battery-powered car] for transport service is relatively small. In contrast, it is the operation phase that remains the dominant contributor to the environmental burden caused by transport service as long as the electricity for the [battery car] is not produced by renewable hydropower ...

A break even analysis shows that an [internal combustion engined vehicle] would need to consume less than 3.9 L/100km to cause lower [environmental impacts] than a [battery car] ... Consumptions in this range are achieved by some small and very efficient diesel [cars], for example, from Ford and Volkswagen.

Actually quite a lot of the new diesels are in the better-than-battery ballpark, according to UK government figures. The notional battery car considered by the EMPA analysts was a Volkswagen Golf with its normal drivetrain replaced by a battery one: but it seems that you would be doing slightly better for the environment to buy an ordinary new Golf with a 1.6 litre "BlueMotion" injected turbodiesel - which would be a lot cheaper. That would consume 3.8 l/100km, not 3.9.

So would a new Mini Cooper D hatchback or a new Ford Focus, actually. And if you could bear to go for something a little smaller - VW Polo rather than Golf - you'd be streets ahead on the environmental front, down as low as 3.4 l/100km with more than 15 per cent of the car's in-service emissions clipped off compared to the 3.9 l/100km battery-car baseline. As the Swiss boffins tell us, it's the in-service energy use and emissions which count most.

You could even treat yourself to a small estate car - the Skoda Fabia - and beat a battery Golf by a large margin in terms of eco-credentials, according to the EMPA analysis.

Of course, battery car lovers will argue that's not the point. Swiss electricity is already largely generated by carbon-free nuclear and hydropower plants (carbon-free provided you don't count all the concrete used to build them, that is). These and other technologies not yet much used (solar, wind, tidal etc) may one day put the battery car far ahead of internal-combustion ones in terms of carbon emissions.

And if nobody buys battery cars now, they'll stay expensive and scarce forever, so it's still possible to view the act of buying one as green even today when they actually do more damage to the environment than the right internal-combustion model.

But if you just want to emit less carbon right away, it seems you should buy a modern eco-diesel rather than an electric vehicle. ®


Powered by ScribeFire.

NASA - NASA's Successful Ice Cloud and Land Elevation Mission Comes to an End

NASA - NASA's Successful Ice Cloud and Land Elevation Mission Comes to an End
"ICESat has been a tremendous scientific success," said Jay Zwally, ICESat's project scientist at NASA's Goddard Space Flight Center in Greenbelt, Md. "It has provided detailed information on how the Earth's polar ice masses are changing with climate warming, as needed for government policy decisions. In particular, ICESat data showed that the Arctic sea ice has been rapidly thinning, which is critical information for revising predictions of how soon the Arctic Ocean might be mostly ice free in summer. It has also shown how much ice is being lost from Greenland and contributing to sea level rise. Thanks to ICESat we now also know that the Antarctic ice sheet is not losing as much ice as some other studies have shown."


Powered by ScribeFire.

What's Holding Antarctic Sea Ice Back From Melting?

NASA - What's Holding Antarctic Sea Ice Back From Melting?

09.01.09

Global temperatures are increasing. Sea levels are rising. Ice sheets in many areas of the world are retreating. Yet there’s something peculiar going on in the oceans around Antarctica: even as global air and ocean temperatures march upward, the extent of the sea ice around the southern continent isn’t decreasing. In fact, it's increasing.

Sea ice at the other end of the world has been making headlines in recent years for retreating at a breakneck pace. Satellite measurements show that, on average, Arctic sea ice has decreased by four percent per decade since the late 1970s, explained Claire Parkinson, a cryospheric scientist at NASA's Goddard Space Flight Center in Greenbelt, Md., who has been tracking the movements of the ice for 30 years. Antarctic sea ice, in contrast, has expanded northward by about 1 percent — the equivalent to 100,000 square kilometers (38,610 square miles) — per decade.

Why is there such a drastic difference in the behavior of the two poles? Scientists from Goddard and the University of Washington, Seattle, recently described three theories — ozone depletion, changing ocean dynamics, and the flooding of sea ice — for what's happening in the Southern Ocean around Antarctica.

Dwindling Ozone Levels

In the 1980s, scientists discovered that emissions of refrigerants and accelerants called chlorofluorocarbons (CFCs) had depleted the ozone layer, especially over Antarctica. Ozone depletion, notorious for permitting more cancer-causing ultraviolet light to reach the surface, has a lesser known impact: It cools the stratosphere, the layer of atmosphere between 10 and 60 kilometers (6 and 37 miles) above the surface.

Since the ozone hole began developing, researchers believe the Antarctic stratosphere has cooled between 2°C and 6°C (3.6°F and 10.8°F). Such cooling changes the dynamics between the stratosphere and lower layers of the atmosphere and strengthens Antarctica's already fierce winds.

Ever since mariners first attempted to navigate the Southern Ocean, the region has been notorious for its powerful and stormy cyclonic winds during the winter. The "polar vortex" whips around the Southern Ocean and produces sustained periods of freezing temperatures unlike any other place in the world.

Since 1980, the strength of the polar vortex has intensified by about 15 percent due to ozone depletion. The loss of ozone caused atmospheric pressure to decrease over the Amundsen Sea, thereby strengthening the winds on the Ross Ice Shelf, according to NASA Goddard scientist Josefino Comiso, coauthor of a recent study that models the connection between ozone, wind speeds, and climate in the Antarctic. The changes help explain one of the paradoxes of the Antarctic: while sea ice in some areas is growing rapidly, it's retreating at a rapid pace in others.

The new model suggests that colder, stormier, and faster winds are rushing over the waters encircling Antarctic — especially the Ross Sea, where ice growth has been the most rapid. The winds create areas of open water near the coast – known as polynyas – that promote sea ice production.

At the same time, warmer air from higher pressure systems are simultaneously encroaching upon the Antarctic Peninsula, one sliver of the continent that is experiencing rapid warming.

"We see a very mixed pattern of both melting and ice growth in the Antarctic," said Thorsten Markus, head of NASA Goddard's Cryospheric Sciences Branch. "Changes in the cyclonic pattern due to the ozone hole are one of the best explanations we have."

A More Stratified Southern Ocean

Changes in ocean circulation may also play a role. Jinlun Zhang, an oceanographer at the University of Washington, has pieced together a complex computer model that helps explain why Antarctic sea ice is expanding even with signs that ocean and air temperatures are on the rise. The key is that warming temperatures can lead to more stratified ocean layers.

In the Southern Ocean, there’s a layer of cold water near the surface and a layer of warmer water below. Normally, convection causes the two layers to mix and exchange water, a process that brings heat from the lower layers to the surface layer and ultimately helps keep sea ice expansion in check. This transfer of heat is the primary reason that first-year ice in the Antarctic is much thinner than in the Arctic.

But if global air temperatures warm, the model indicates that the amount of rain and snowfall could increase, and surface waters could freshen. Since fresh water is less dense and less apt to mix with the heavier, saltier, and warmer water below, the layer at the ocean's surface could become more stratified and mix less. This, in turn, would reduce the amount of heat flowing upward, allowing surface ice to expand.

Field measurements suggest that there has been a marked freshening of some parts of the Southern Ocean. Researchers from Columbia University, New York City, have detailed a freshening in the Ross Sea, and a recent study shows that the Antarctic-Australian Bottom Water has freshened somewhat since the mid-1990s. Still, Zhang cautions that scientists can’t yet say without qualification that all of the Southern Ocean is freshening.

"Though the limited data available does suggest wide-scale freshening, we need more data to confirm this," he said. NASA’s Aquarius instrument, which will launch on Argentina's SAC-D satellite in 2010, will perform global measurements of ocean salinity and should help provide such data.

Flooded Sea Ice Turns Snow to Ice

Water-logged sea ice is the third phenomenon that may explain why sea ice in the Antarctic is increasing. The process, which scientists call "snow-to-ice conversion," occurs when the weight of accumulated snow presses down on a slab of sea ice until it's nearly submerged. When that happens, waves cause ocean water to spill on top of the ice and into the snow, forming a layer that eventually freezes and becomes "snow ice."

"You can add eight-to-ten centimeters to the thickness of sea ice each time this happens," said Markus. Though this process doesn't directly affect sea ice extent as observed over short time periods, some scientists believe it may have an impact on ice extent over the course of a full season.

Ice formed in this manner isn’t easy to distinguish without performing tests on isotopes, yet scientists believe thickening from snow ice is ubiquitous around Antarctica. Researchers have discovered it on Antarctic pack ice in all regions and during all seasons, with the most snow ice formation occurring in the Eastern Ross and Amundsen Seas. One study suggests that snow-ice constitutes as much as 38 percent of the sea ice mass in these areas. However, such numbers are difficult to pin down definitively, given the complexities of field research in the extreme conditions of the continent.

"We’ve made some progress," said Markus, "but in the next few years, I think we're going to see much more detailed measurements of the flooding of the snow-ice interface."


Powered by ScribeFire.

Greenland ice loss rates 'one-third' of what was thought

Greenland ice loss rates 'one-third' of what was thought • The Register

By Lewis Page

Posted in Environment, 7th September 2010 09:52 GMT

The rate at which ice is disappearing from Greenland and Western Antarctica has been seriously overestimated, according to new research.
Contrasting estimates of Greenland ice melt. Previous analysis in blue: New in red. The colour bands represent uncertainty. Credit: Nature Geoscience

'Deviates rather sharply from general assumptions' - Yes.

Measuring a disappearing ice cap is actually quite difficult to do, as the areas in question are remote, hostile environments and the exact depth of ice is often unknown. This has caused a lot of argument among climate scientists regarding how much ice is melting and running into the sea, as this affects predictions of sea-level rise and other aspects of climate modelling. (Floating sea ice, like that which makes up most of the Arctic cap apart from Greenland, is less of an issue as its melting doesn't affect the sea level.)

Thus it is that since 2002, NASA's Gravity Recovery and Climate Experiment (GRACE) satellite data has been used to make an estimate of ice melt from Greenland and Western Antarctica. (The rest of Antarctica doesn't seem to be melting at all - indeed Antarctica as a whole is actually gaining ice area rather than losing it - but some regions in the West are melting. The reasons for this are under investigation.)

The original GRACE-based estimates indicated as much as 1,500 billion tonnes ice loss just from Greenland in the period 2003-2009 - equivalent to a global sea-level rise of over 4mm on its own. However it has since become clear that these numbers weren't properly corrected for the phenomenon of "rebound", where the Earth's crust rises as ice is removed. GPS precise-location devices fixed to bedrock outcrops in Antarctica showed this last year, but nobody was sure how bad the errors were.

Now a team of researchers based at NASA's Jet Propulsion Laboratory and in the Netherlands say they have the answer.

"The corrections for deformations of the Earth’s crust have a considerable effect on the amount of ice that is estimated to be melting each year," explains Dr Bert Vermeersen. "We have concluded that the Greenland and West Antarctica ice caps are melting at approximately half the speed originally predicted."

Vermeersen and his colleagues' calculations show that as little as 500 gigatonnes of ice or even less could have melted from Greenland during 2003-2009, translating into less than 2mm of sea-level rise. In the case of Greenland, it could be that the current estimates are triple what they should be.

"For Greenland in particular, we have found a glacial isostatic adjustment model that deviates rather sharply from general assumptions," says Vermeersen.

Both the JPL/Dutch team and other boffins examining the work caution that more GPS locators need to be attached to the bedrock in order to refine the results.


Powered by ScribeFire.

Antarctic glacier melt maybe 'not due to climate change'

Antarctic glacier melt maybe 'not due to climate change' • The Register
By Lewis Page

Posted in Environment, 21st June 2010 10:39 GMT

British and international boffins, having probed an Antarctic glacier which is thought to be a major cause of rising sea levels worldwide, report that increased polar ice melting may not be driven by climate change.

The massive ice river in question is the Pine Island Glacier, aka PIG to those in the field.

“Estimates of Antarctica’s recent contributions to sea level rise have changed from near-zero to significant and increasing," says Stan Jacobs of Columbia uni in the States. "Increased melting of continental ice also appears to be the primary cause of persistent ocean freshening and other impacts."

The PIG has flowed more and more rapidly into the Amundsen Sea since scientists have begun monitoring it, adding fresh water to the world's oceans. Like certain other regions the glacier is bucking the overall south-polar trend which has actually seen hundreds of thousands of square kilometres of new sea ice accumulate around Antarctica in recent decades.

Many scientists have theorised that the PIG's accelerating flow is due to global warming. However, recent research - including surveys beneath the bottom of the floating, projecting ice sheet by Blighty's Autosub robot probe - indicate that this may not be the case. (The Autosub, famously, was powered by some 5,000 ordinary alkaline D-cell batteries on each trip beneath the ice, getting through some four tonnes of them during the research.)

It appears from the Autosub's under-ice surveys that the PIG's ice flow formerly ground its way out to sea across the top of a previously unknown rocky underwater ridge, which tended to hold it back. Many years ago, however, before the area was surveyed in much detail, the glacier's floating outflow sheet separated from the ridge top which it had been grinding away at for millennia and so picked up speed. This also allowed relatively warm sea water to get up under the sheet and so increase melting and ease of movement.

“The discovery of the ridge has raised new questions about whether the current loss of ice from Pine Island Glacier is caused by recent climate change or is a continuation of a longer-term process that began when the glacier disconnected from the ridge," says Dr Adrian Jenkins of the British Antarctic Survey.

Jenkins, Jacobs and their colleagues write:

Once the grounding line began its downslope migration from the ridge crest prior to the 1970’s, a period of rapid change was inevitable, and since that time oceanic variability may have had relatively little influence on the rate of retreat.

Or in other words the glacier would have shown the same acceleration and thinning it has shown since the 1990s with or without climate change, perhaps accounting for its very rapid melting and the local contrast with the general picture of increased Antarctic sea ice.


Powered by ScribeFire.